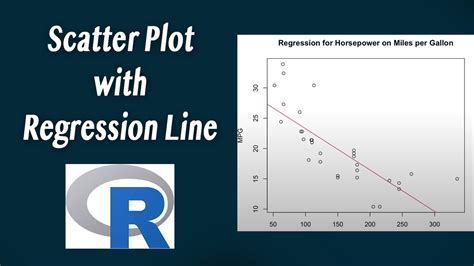
You can combine multiple geoms into a single ggplot2 plot using the + operator. To achieve your desired output, you need to specify both geom_point() and geom_line() in the same call.
Here's how you can do it:
p <- ggplot(observedData, aes(x = Data_X, y = Data_Y)) +
 geom_point(aes(colour = Data_Z), size = 2) +
 scale_colour_gradient(low = "green", high="red") +
 geom_line(aes(x = Model1_X, y = Model1_Y), colour = "blue")
In this code:
p <- ggplot(observedData, aes(x = Data_X, y = Data_Y))sets up the plot with x and y axes.geom_point(aes(colour = Data_Z), size = 2)creates a scatterplot of observed data points colored byData_Z. Thesize = 2argument increases the size of the points.scale_colour_gradient(low = "green", high="red")sets up a color scale for the points, ranging from green to red.geom_line(aes(x = Model1_X, y = Model1_Y), colour = "blue")adds a line plot based on your model data (Model1_XandModel1_Y). The line is blue in this case.
The + operator combines these geoms into a single ggplot2 object.
