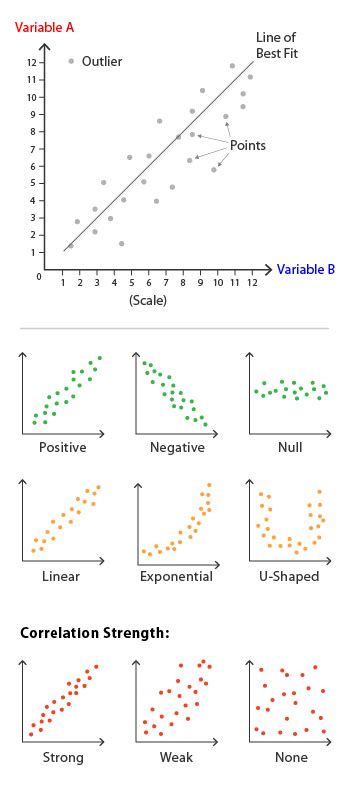
In the world of data visualization, scatter plots are an essential tool for exploring relationships between two or more variables. This article will delve into the world of scatter plots, covering everything from the basics to advanced techniques and best practices.
What is a Scatter Plot?
A scatter plot, also known as a scatter diagram or X-Y plot, is a graph that displays the relationship between two continuous variables. The plot consists of points on a two-dimensional grid, with each point representing a single data observation. The x-axis typically represents one variable, while the y-axis represents another.
Basic Concepts
Before diving into advanced techniques, let's cover some basic concepts:
- Correlation: A measure of how closely related two variables are.
- Regression: A statistical model that describes the relationship between two variables.
- Outliers: Data points that don't follow the expected pattern or trend.
Creating a Scatter Plot
To create a scatter plot, you'll need to:
- Identify the two variables you want to explore.
- Determine which variable will be on the x-axis and which on the y-axis.
- Choose a visualization tool or software that supports scatter plots (e.g., Excel, Tableau, Power BI).
Customizing Your Scatter Plot
To get the most out of your scatter plot, consider these customization options:
- Add a trend line: A basic linear trend line can help visualize the relationship between variables.
- Color points by third variable: If you have a third categorical variable, use color to encode it. This helps identify patterns or trends in the data.
- Use different shapes or sizes: If you have multiple groups or categories, use shape or size to differentiate them.
Advanced Techniques
Take your scatter plot game to the next level with these advanced techniques:
- Heatmaps: Use heatmaps when you have a large number of data points that need to be plotted.
- Connected scatter plots: Use this type of plot if you want to visualize changes over time or to show relationships between variables with timestamps.
Best Practices
To create effective scatter plots, follow these best practices:
- Use clear labels and titles: Make sure your plot is easy to understand by labeling the axes and title accurately.
- Choose a suitable scale: Ensure that your x- and y-axis scales are reasonable and don't exaggerate or diminish relationships between variables.
- Remove outliers: If you have outliers, consider removing them or using techniques like Winsorizing to reduce their impact.
Mastering scatter plots is an essential skill for any data analyst or scientist. By understanding the basics, customizing your plot, and applying advanced techniques, you'll be able to effectively explore relationships between variables and draw meaningful insights from your data.
