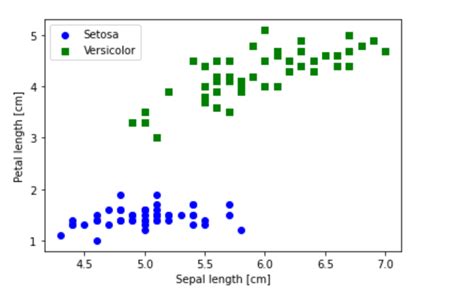
You are using the wrong argument for coloring your scatter plot. You should use c instead of cmap. The c argument is used to specify the color of each point, and it should be a sequence (like an array or list) of colors.
Here's how you can modify your code:
import numpy as np
import pandas as pd
from sklearn.datasets import load_iris

iris = load_iris()
print(list(iris.feature_names))
print (iris.target)
data = pd.DataFrame(iris.data)
data.columns = iris.feature_names
data['label'] = iris.target
data.head()
import matplotlib.pyplot as plt
import matplotlib.colors as mcolors

# create a scatter plot of SEPAL WIDTH versus SEPAL LENGTH and color by SPECIES
color_map = {0: '#FF0000', 1: '#00FF00', 2: '#0000FF'}
c = [color_map[i] for i in data['label']]
plt.scatter(data['sepal length (cm)'], data['sepal width (cm)'], c=c)
plt.title("Sepal Width vs Sepal Length")
plt.xlabel('x label')
plt.ylabel('y label')
plt.show()
In this code, we first create a dictionary color_map that maps each species to its corresponding color. Then, we use list comprehension to generate the colors based on the species of each data point. This list is then passed as the c argument to the scatter function.
