Written by Hyemin on September 17, 2017
When it comes to displaying data in a visual format, there are times when text-based lists just won't cut it. For instance, presenting statistical information to users requires a more engaging and intuitive approach. That's where open-source libraries like MPAndroidChart come into play.
MPAndroidChart is an open-source library that helps you create various types of charts for your Android applications. The library provides a wide range of chart types, including:
- Line Chart
- Bar Chart
- Combined-Chart (Line + Bar)
- Horizontal-Bar Chart
- Pie Chart
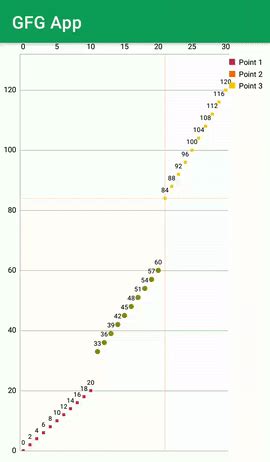
- Scatter Chart
- Candle Stick Chart
- Bubble Chart
- Radar Chart
The library is quite powerful and can help you create complex charts with ease. However, when it comes to dynamically assigning chart data, things can get a bit tricky. As someone who's new to Android development, I found that the learning curve was steeper than expected.
To make things easier for beginners like myself, MPAndroidChart provides excellent documentation and sample code. With some trial and error, you'll be able to create your own custom charts in no time!
Challenges I faced
When using MPAndroidChart, I encountered three main challenges:
- Assigning values to the x-axis: This was the most difficult part for me. I had to use the
setValueFormattermethod to assign dates to the x-axis.
XAxis xAxis = mLineChart.getXAxis();
xAxis.setValueFormatter(new IAxisValueFormatter() {
 @Override
 public String getFormattedValue(float value, AxisBase axis) {
 if (dateArrayList.size() > (int) value) {
 return dateArrayList.get((int) value);
 } else return null;
 }

 @Override
 public int getDecimalDigits() {
 return 0;
 }
});
- Adjusting the space between chart axes: By default, the space between the chart axes is too small, making it difficult to read. To fix this, I used the
setYOffsetandsetXOffsetmethods.
mLineChart.getXAxis().setYOffset(15f);
mLineChart.getAxisLeft().setXOffset(15f);
- Removing duplicate values on the x-axis: When there are fewer than 6 data points, MPAndroidChart can display duplicate values on the x-axis. To fix this, I enabled granularity using the
setGranularityEnabledmethod.
xAxis.setGranularityEnabled(true);
Overall, MPAndroidChart is a fantastic library that can help you create complex charts for your Android applications. With some practice and patience, you'll be able to overcome the challenges and create stunning visualizations that will impress your users!
